
Article Summary
Preparing for Power BI interview questions means reviewing topics across data visualization, Power Query, DAX functions, and Power BI Service. This article covers 35 questions with answers grouped by topic. You'll walk into your interview ready to tackle both foundational and advanced questions with confidence.
These Power BI interview questions and answers can help you test your knowledge of the popular data analytics tool. Microsoft’s official Power BI 70-778 and DA-100 certifications require knowledge of these topics. Prepare for the exams by studying the following questions, grouped by topic.
General questions
1. Name the four main processes for creating and uploading a Power BI report onto the Power BI Server.
This typically includes:
- Get and Transform Data, also known as Power Query, which involves importing data and manipulating it.
- Data Modeling the data. This allows for adding calculated columns, measures, and relationships between data sources.
- Adding data visualizations.
- Publishing onto the Power BI Service.
Recommended Udemy course

2. What are the main programs, apps, or options for buying or using Microsoft Power BI?
- Power BI Desktop is the program in which you can create visualizations.
- Power BI Pro is a subscription-based service. It allows you to distribute the content created with Power BI Desktop and upload it to Power BI Server, Microsoft’s cloud-based server.
- Power BI Premium is a dedicated cloud-based server.
- Power BI Mobile is an app for your mobile device.
- Power BI Embedded allows you to embed your data analysis into your own applications.
- Power BI Report Server is a non-cloud service, installed onto your servers.
Data Visualization questions
These questions cover the various visualizations possible in Power BI and how you can customize them to display the analysis you want.
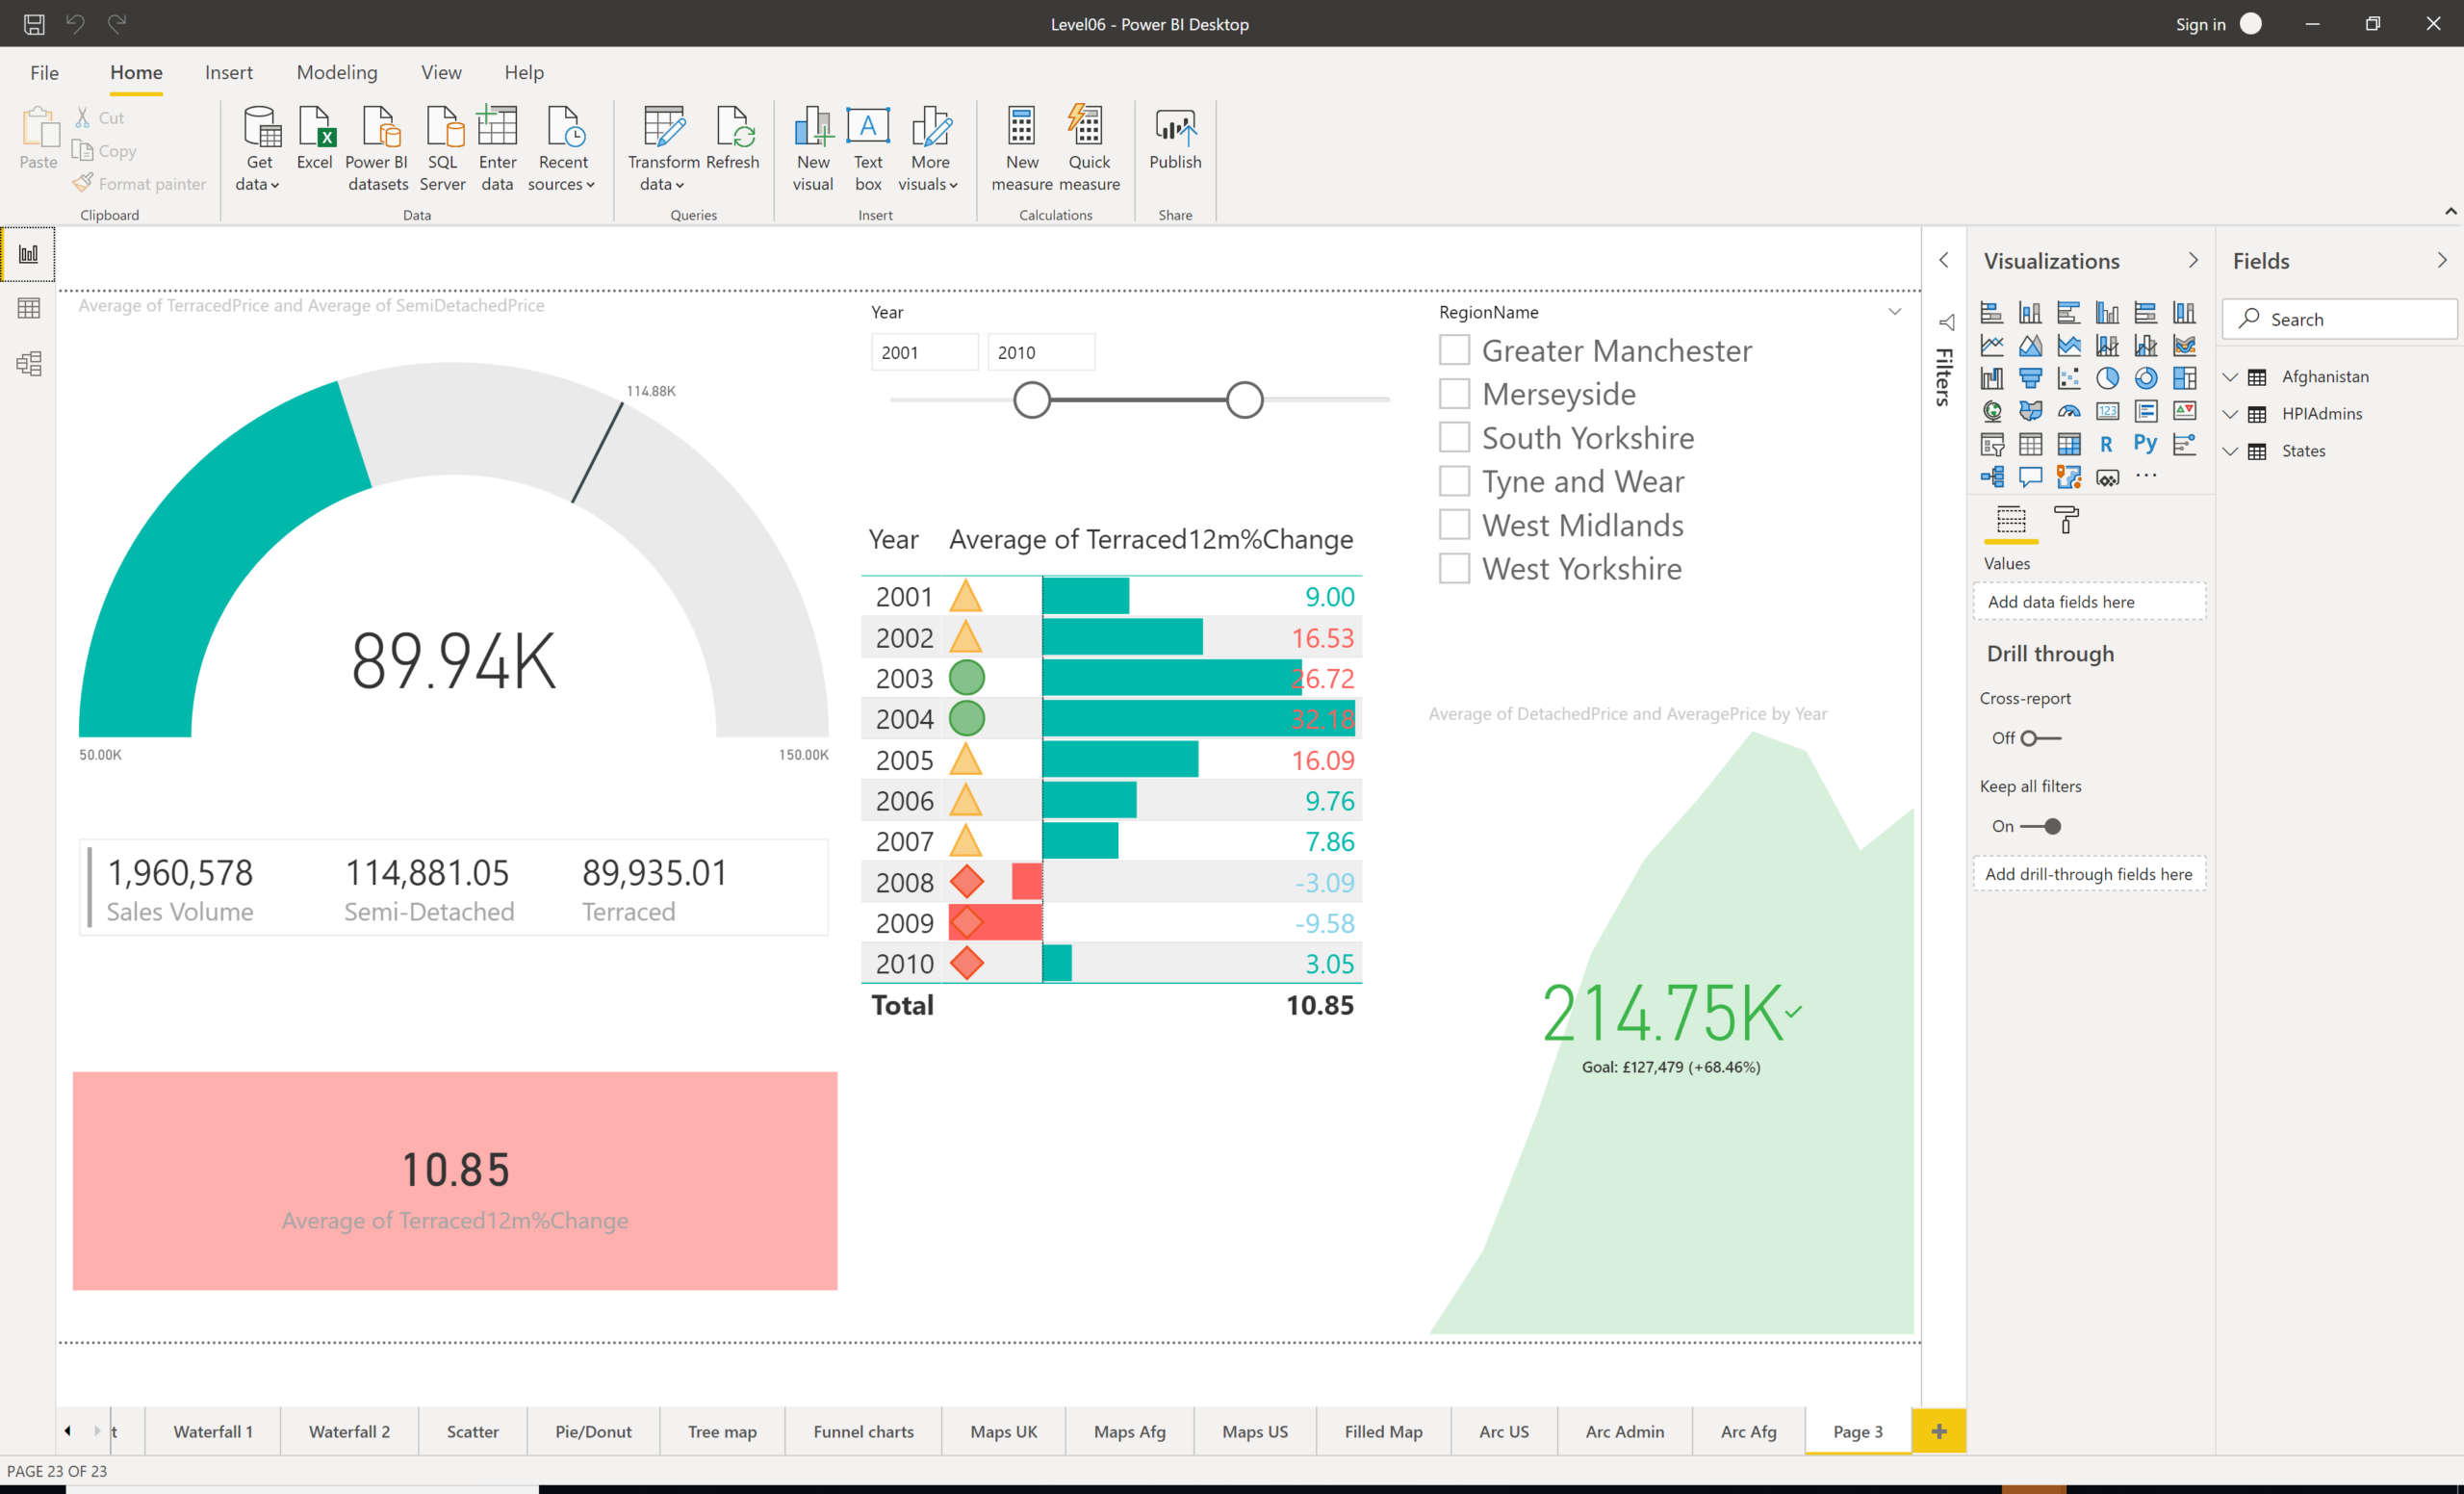
3. What are the differences and similarities between a table and a matrix visualization?
Both tables and matrixes show data in a text format, similar to a spreadsheet.
Note that the plural of “matrix” in Power BI is “matrixes” rather than “matrices.”
Tables can show one row for each source table row. Both tables and matrixes can show aggregated values (such as SUM, COUNT, MIN, or MAX).
A table shows one column for each field used. So if you have six fields included in a table, there would be six columns.
A matrix is equivalent to an Excel PivotTable, so the number of columns is variable. If a matrix has four rows fields and one column field for a date which includes 10 different years, then you would have 14 different columns when the years are being displayed — 15 columns if you include the total. But if you drill down the column year field to include quarters or months, the number of columns in the matrix changes.
4. What is the difference between drill down and drill through?
When you use Drill Down, you go to a different level of detail. For example, you may be looking at a matrix that currently shows years. You can drill down so that the matrix shows quarters or months. Or you could show the combination of years and quarters and months.
When you use Drill Through, you go from one report to another that concentrates on some aspect of the first report. For example, you might click on a country in one report, and drill through to a second report that concentrates on that country.
5. How can you add Drill Through to a report and how can you use it?
Suppose you wanted page A to drill through to page B.
You can add drill through by going to page B and dragging the relevant field to the Add Drill Through Fields Here section.
You use Drill Through by going to page A, and then:
1. Clicking on the field you want to focus on
2. Going to Data/Drill —> Drill Through or right-clicking on the field and going to Drill Through in the Context menu
6. What interactions can you have between different visualizations and how can you control them?
The three interactions are: filter, highlight, and none.
Here’s how to control the interactions:
1. Go to Format —> Edit Interactions
2. Select a visualization
3. Select which particular interaction (filter, highlight, or none) you want to happen on the second visualization
7. What are the three types of filters in Power BI?
The three types of filters are:
- Visual filters, which controls filters on one particular visualization
- Page filters, which filters all the visualizations on one page
- Report filters (also known as Filters On All Pages), which filters all the visualizations on all pages
8. What visualization allows the end-user to apply a single filter over several pages at the same time? And how can you configure which pages it filters?
You can use a slicer, which allows you to filter on one page or multiple pages. Configure which pages a slicer filters by going to View —> Sync Slicers.
9. How can you show an invisible visualization?
Go to View —> Selection, which lists all the visualizations on the page, visible and invisible. Toggle visibility for any visualization in this pane.
10. You set up a bar chart with the year in the X-axis and sales in the Y-axis. How can you sort it so that the years are shown in sales order, instead of year order?
By default, fields such as years are shown in a continuous sequence. For example, 2025 follows 2024 and is before 2026.
To show it in a different order, go to Visualizations —> Format —> X-axis, and change Type from Continuous to Categorical. You can then sort the visualization by clicking on More Options (the three dots in the top right corner of the visualization) and click on Sort By —> Sales.
11. You have set up your page as you want to show it later. How can you save this setup for future use? Name two ways you can retrieve it.
You can save your set up by using a Bookmark. Go to View —> Bookmarks and click on Add.
You can also modify the bookmark so you can choose whether it remembers: the Data, the Display, and/or the Current Page, and which visuals it remembers.
To retrieve your Bookmarks, you can go to View —> Bookmarks again and click on the relevant bookmark. Or, insert a shape, button, or another control with an Action, and change the Action so that it goes to the relevant bookmark. This is a more user-friendly way for the end-user to choose different bookmarks.
12. How do you add conditional formatting to a table?
To add conditional formatting:
1. Select the relevant field in a visualization
2. Go to Visualizations —> Format —>Conditional Formatting —> Font Color (or Background Color)
3. Switch this to On
You can then control the formatting by going to Advanced Controls within Conditional Formatting.
Power Query questions
The next set of questions is about Get and Transform Data, which is also known as Power Query. This shows a series of steps that you can use to manipulate data into a better format for your visualizations.
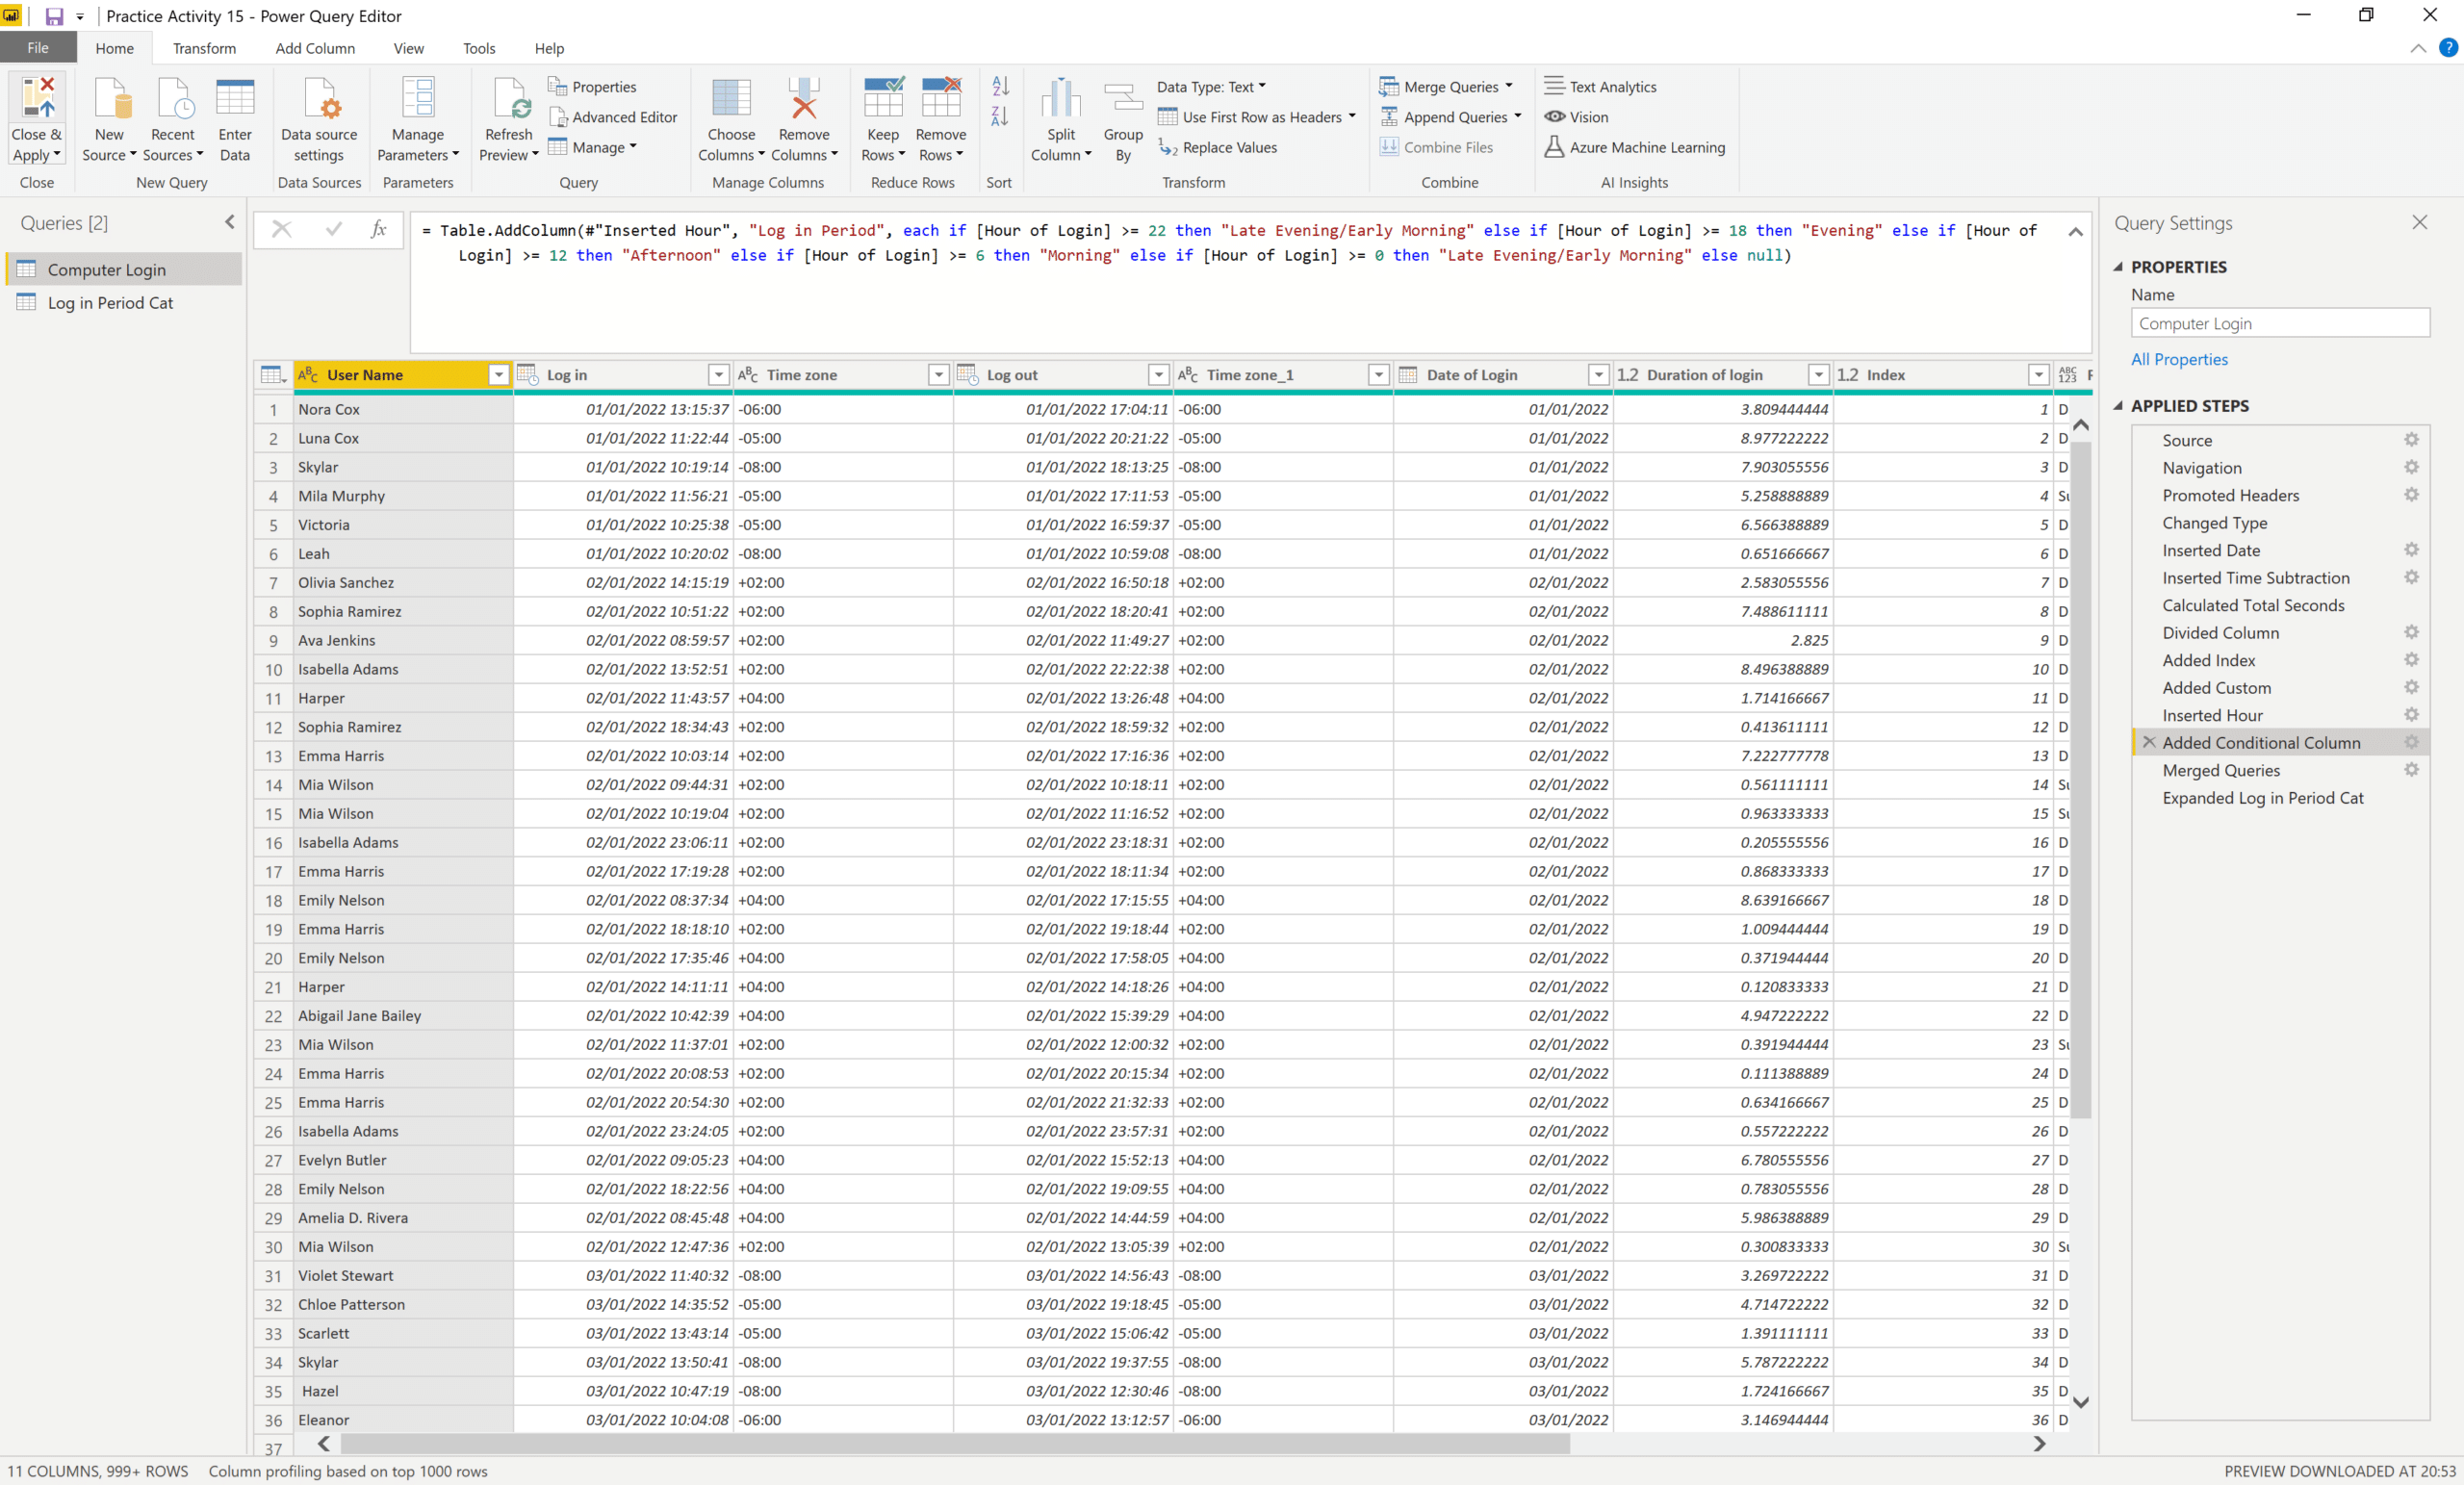
13. I’ve imported the data, but the wrong row is being used as the headers — the row below should be used instead. What do I do?
The Applied Steps pane in Power Query shows the process that Get and Transform Data uses. When you load data initially, then the computer adds a few steps automatically. They typically include:
- Source – where you are loading the data from
- Navigation – the specific data set within the Source
- Promoted Headers – setting the top row of the data as the headers
- Changed Type – changing the data type of the columns to a more specific data type which still allows for all the sample data loaded in the column
However, if the first row was not meant to be used as the header (for example, there is a title in the data set, and the headers are in the second row), then this can be premature.
In the above example, to remove the Promoted Headers:
1. Remove the Change Type step (as Applied Steps should be removed in reverse order)
2. Remove the Promoted Headers step
3. You can remove any Applied Steps by clicking on the x next to these steps
4. To remove any rows which should not be included in the data, go to Home —> Remove Rows, and enter the number of rows to be removed
5. To Promote the new top row to be used as headers, go to Home or Transform, then Use First Row as Headers
6. It’s a good idea to change the data types of your columns, most simply by selecting all of the columns and going to Transform —> Detect Data Type (and correcting any errors)
14. What is the name of the formula language used in Get and Transform (or Power Query)?
It is called the “M” language (“M” is short for “Mashup”).
15. Name three ways to remove columns from your data
There are several ways to remove columns from your imported data. They include:
- Right-click on a column or columns that you want to remove and select Remove.
- Go to Home —> Choose Columns. You can then uncheck columns you do not wish to keep.
- Select the columns you want to remove and go to Home —> Remove Columns —> Remove Columns.
- Select the columns you want to keep and go to Home —> Remove Columns —> Remove Other Columns.
- Use the Table.RemoveColumns formula.
16. What is the difference between merge queries, append queries, and combine files?
- Merge queries allows you to introduce columns from one query into another (or a new) query.
- Append queries allows you to introduce rows from one query into another (or a new) query.
- Combine files allows you to load files on your computer and combine them into a new query. The advantages of this include that these individual files don’t have to become individual queries first and that you can simply point to an entire folder as the source.
17. What is wrong with this M function: Table.transformcolumns?
M is case-sensitive. It should read: Table.TransformColumns
18. Name two different ways to convert a text column to date format.
Ways to convert a text column to date format include:
- Clicking on the ABC or ABC123 icon next to the field name and selecting Date or Date/Time.
- Selecting the column and going to Home —> Data Type —> Date/Time.
- Selecting the column and going to Transform —> Date —> Parse.
The advantage of the last method is that it uses the DateTimeZone.From(_) formula, which you can modify to change the locale. This is useful if, for example, your computer is set up in American date format, but the dates are shown in British format. In this case, you can modify the DateTimeZone.From formula to include the fact that the dates are in the British format.
19. How do you use hard code the date 2 March 2024 in a formula?
You would use #date(2024,3,2). Make sure that “date” is all in lower case letters.
20. What is the quickest way to create a list of dates from 1 January 2022 to 31 December 2022 with every date included?
The quickest way to create a list of dates is:
- Go to Home —> New Source —> Blank Query
- Type in the formula bar: =List.Dates(#date(2022,1,1),365,#duration(1,0,0,0)) and press Enter
- Go to Transform —> Convert —> To Table and press OK
- Then convert this new column in this query to dates by going to Home —> Transform —> Data Type —> Date
21. What is Query Folding and what are its advantages?
When loading data from SQL Server or similar databases, it is possible that Power BI will interpret some of the Applied Steps that you enter by changing the initial SQL Server SELECT statement. The advantages of this are:
- The processing of these steps is done in SQL Server.
- The number of columns and rows retrieved from SQL Server is typically reduced.
- The data can be loaded more quickly, reducing processing time and bandwidth requirements.
DAX Functions questions
22. When using DAX formulas, what is BLANK()? Give an example of when you should use it.
BLANK() is the equivalent of NULL in other languages. It means that the answer is nothing.
You should use it when using zero or an empty string would lead to the wrong result in a later formula. For example, there is a difference between 0+1 and BLANK()+1, as the latter results in BLANK() instead of 1.
23. Can you write a formula that returns the number 1 only if all of the following are true: [Price] > 2, [Price] < 10, and [Price]<>5 ?
You can use the following formula: =IF(OR(OR([Price] > 2, [Price] < 10), [Price]<>5),1,0)
Unlike OR in Excel, the OR function in DAX can only have two arguments. You have to nest ORs if you want to have more than two arguments.
24. Why shouldn’t you write the following DAX formula =MID([Description],10,1) ?
This formula is meant to retrieve the tenth character in the field [Description]. However, unlike Excel, if you use this when [Description] is less than 10 characters long, it will result in an error. This error will then cascade throughout the column, meaning that the entire column will result in errors.
You should couple this formula with IFERROR, or IF and LEN, to trap this error.
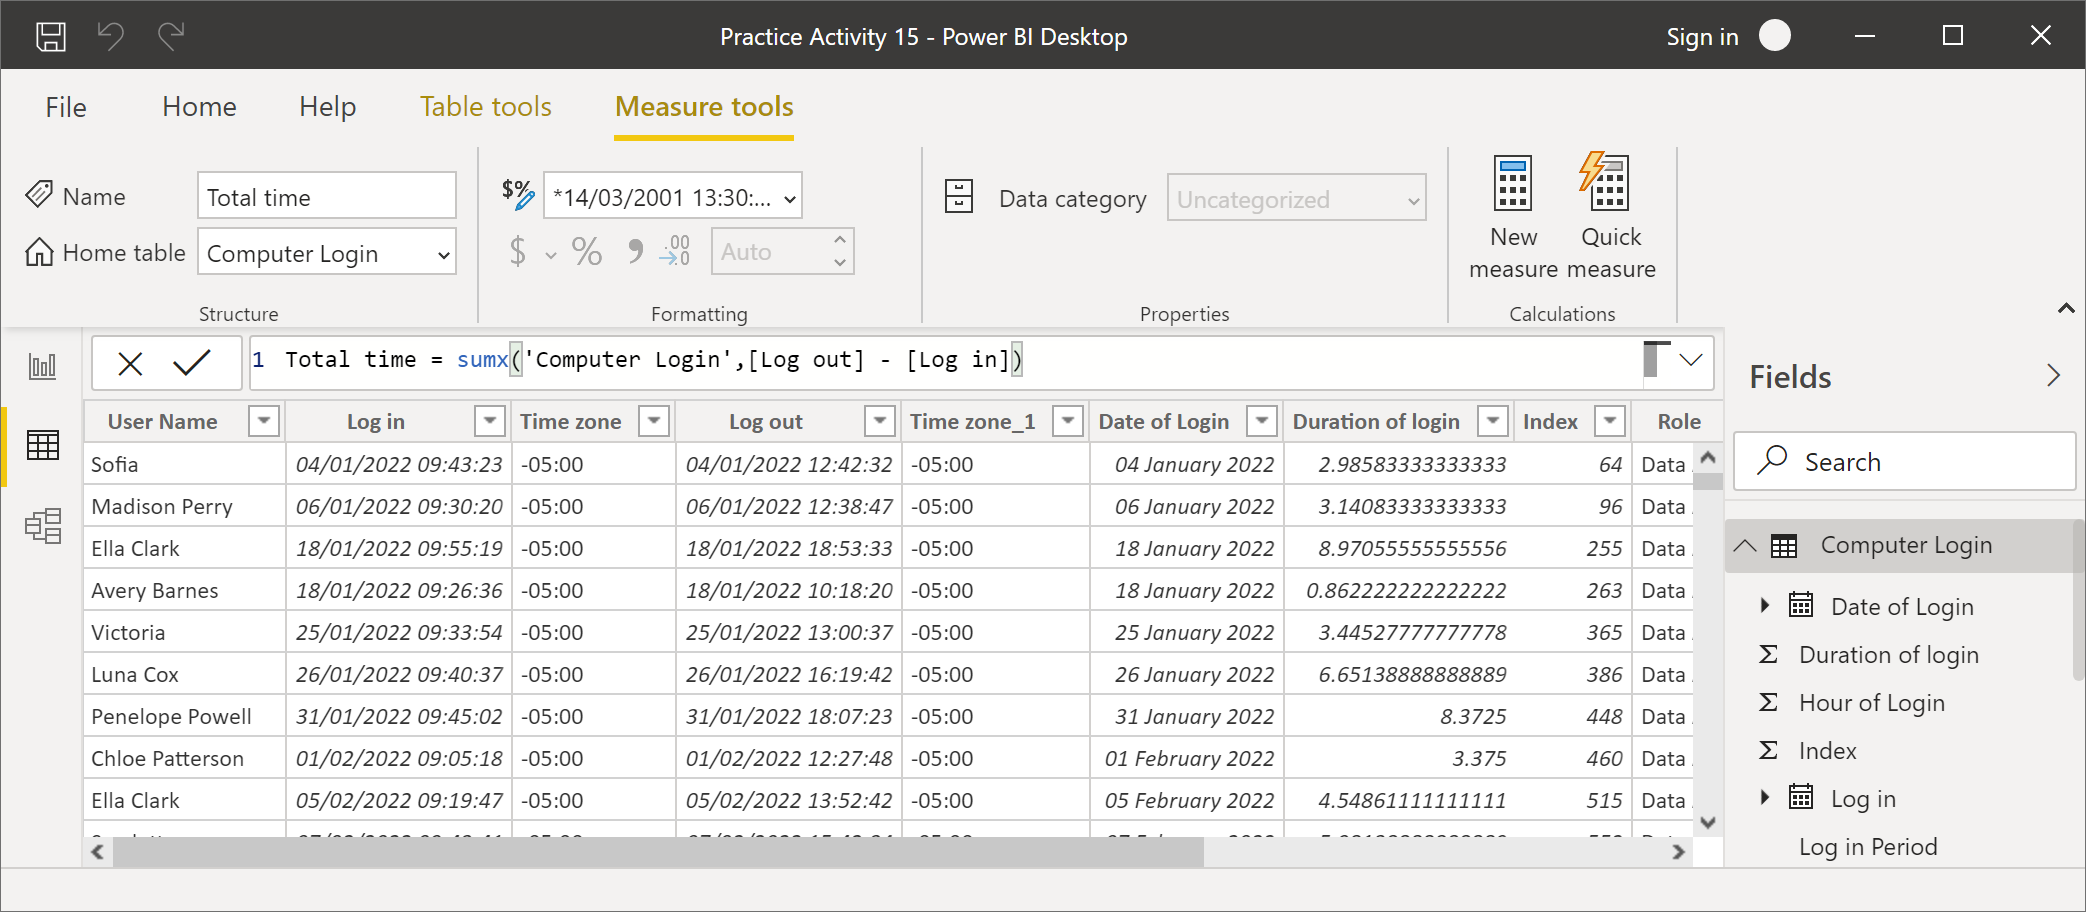
25. What is the difference between a calculated column and a measure?
A calculated column results in an answer for each and every row in a query. A measure results in one answer for each context in which it is calculated.
Because the calculated column needs to calculate an answer for each row, this results in an increase in the processing power needed.
Some functions that you can use validly in calculated columns cannot be used in measures, and vice versa.
26. Name 4 DAX rounding functions (these are functions used in mathematics).
Some of the DAX rounding functions are:
- INT – gives the nearest whole number rounded down
- CEILING, FLOOR, and MROUND – rounds to the nearest multiple of significance (for example, to the nearest 0.05), either up, down, or nearest
- ROUNDUP, ROUNDDOWN, and ROUND – rounds to a specified number of decimal places (for example, to one decimal place), either up, down, or nearest
- TRUNC – truncates the number, removing all digits after a certain point (e.g. after the first decimal place)
27. What are the differences between RELATED and RELATEDTABLE?
Let’s assume that there are two tables, A and B, which may be data from different sources, but are connected using a one-to-many relationship. For example, table A could be a list of employees, and table B a list of their expenses, and a single employee could have multiple expenses.
RELATED allows you to get a single value where the relationship goes from “many” to “one” based on the current filter context. For example, you could add a calculated column using the RELATED formula in table B to import an employee’s name from table A.
RELATEDTABLE allows you to get multiple rows where the relationship goes in the opposite direction, from “one” to “many.” For example, you could add a calculated column in table A using the RELATEDTABLE formula to get all the expenses.
RELATEDTABLE typically requires another function, such as SUM, to deal with the multiple rows.
28. What is the difference between SUM and SUMX?
SUM totals (for example) a column in a table, based on context. So if the context is a particular employee, then SUM could total all of the expenses for that employee.
SUMX allows you to do a calculation before totaling the column. For example, you could multiply two fields together, such as the number of items by the unit price for each item, before totaling the column.
29. What does the CALCULATE function do?
The CALCULATE function allows you to perform an expression based on a filter. For example, you could calculate all of the expenses for a particular employee, but only for a particular month.
30. If DueDate for a particular context is July 17, 2025, what period does the formula DATESINPERIOD([DueDate],FIRSTDATE([DueDate]),-7,DAY) retrieve?
As the number of days is negative, the period goes before the July 17, 2025 date.
However, it goes back for seven days inclusive, so the first date is July 11, not July 10. So the total period is July 11-17, 2025.
Power BI Service questions
31. In Power BI Service, what technically is a dashboard?
A dashboard is a series of visualizations taken from various Power BI reports. So you can take a visualization from one report and another from a second report. Therefore, dashboards can be used as a high-level summary.
While a report may be loosely referred to as a dashboard, the term “dashboard” has a specific meaning in the Power BI Service.
32. What is the difference between a dashboard and a report in Power BI service?
- A report is a single piece of work, generally created in Power BI Desktop, and uploaded to the Power BI Service. A dashboard contains extracts from many reports and is created in the Power BI service.
- A report is generally based on a single data source or a set of related data sources. A dashboard does not have any independent data sources, so it may have many data sources based on its source reports.
33. What is a Power BI app?
A Power BI app is a packaged series of dashboards and reports that can be shared.
34. In what two places do you configure row-level security?
1. Create roles while you are editing in Power BI Desktop using DAX expressions.
2. After uploading it into the Power BI service, add Row Level Security to the Dataset.
35. How can you refresh data stored on Power BI when the data is stored on your machine or network?
You should use a data management gateway. There are two different types:
- The on-premises data gateway should be used if you have multiple users connecting to the data sources.
- The on-premises data gateway (personal mode) should be used if you have one user connecting to sources.
I hope you found these interview questions useful. Answers to these questions can be found in my course Analyzing and Visualizing Data with Power BI, which covers all the visualization and analytical topics you need for the 70-778 and DA-100 certifications.