
Article Summary
Exploring flowchart examples reveals how visual diagrams map decisions and processes across programming and beyond. This article covers flowchart types, standard symbols, and real coding examples in C, Java, and JavaScript. You'll gain a clear understanding of how flowcharts improve logic, structure, and programming efficiency.
A flowchart is a graphical depiction of decisions and the results of those decisions. They are used to analyze, design, document or manage a process or diagram in different fields. Similar to other kinds of diagram, they help visualize what is going on. This helps to understand a process and find any flaws and bottlenecks in it.
The program flowchart is analogous to the blue print of a building. A designer draws a blue print before beginning to construct a building. In the same manner, a programmer draws a flowchart before writing a computer program based on the flowchart. Just like drawing a blueprint, the flowchart is drawn based on defined rules which includes standard flowchart symbols given by the American National Standard Institute, Inc. You can easily make flowcharts in MS Word or even MS PowerPoint (you can learn more about how to use PowerPoint in this course)
A flowchart has diagrams that illustrate the sequence of operations to be performed to get the solution of a particular problem. It enables communication between programmers and clients. Once a flowchart is drawn, it becomes comparatively easy to write the program in any high level language. In other words, flow charts are mandatory for good documentation of a complex program.
Types of Flow Charts
- High Level Flowchart
This flowchart illustrates the major steps in a process. It also gives the intermediate outputs of each step and the sub steps involved. Also it provides a basic picture of the process and identifies the changes taking place within the process.
- Detailed Flowchart
This flowchart gives a detailed picture of a process by including all of the steps and activities that occur in the process. It is useful to examine areas of the process in detail and pinpointing problems or areas of inefficiency.
- Deployment or Matrix Flowchart
This flowchart is in the form of a matrix which shows the various participants and the flow of steps between those participants.
Flowchart Symbols
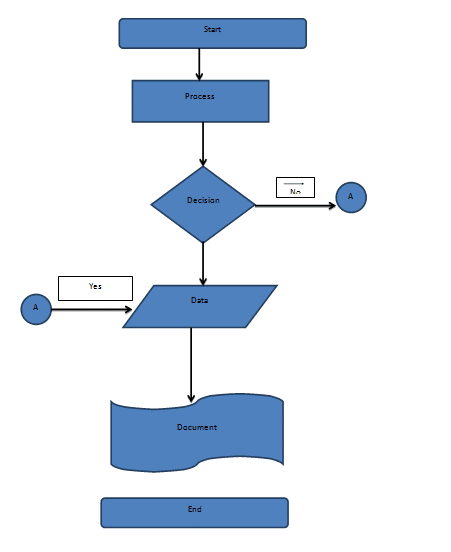
- Start and End Symbols: They are usually depicted by circles, ovals or rounded rectangles. Normally the start symbol has the word “START” in it. The end symbol has the word “END” in it.
- Arrows: They show the flow of control. When an arrow comes from one symbol and ends at another symbol, it means that the program control will pass to the symbol the arrow points to.
- Rectangles: They represent an action, operation or process.
- Subroutines: They are usually depicted by rectangles with double struck vertical edges.
- Input/Output: They are usually depicted by parallelograms.
- Conditional or Decision: It is depicted as a diamond. It has two arrows coming out of it. One arrow corresponds to “Yes” or “True”. The other arrow corresponds to “No” or “False”.
- Labeled Connectors: These are depicted by an identifying label inside a circle. Labeled connectors are used in multi sheet diagrams in place of arrows. Note that for every label, the outflow connector should always be unique. However there is no restriction on the number of inflow connectors.
- Junction Symbol: It will have more than one arrow as input but only one as output.
- Concurrency Symbol: This is depicted by a double transverse line with no restriction on the number of entry and exit arrows. Concurrency symbols are used when 2or more control flows must operate simultaneously. Note that a concurrency symbol with a single entry flow is termed a fork and one with a single exit flow is termed a join.
You can see a simple flow chart with these symbols below. Note that most MS Office tools have built in shapes etc to create simple flow charts, you may want to use something like Illustrator or similar tools for more complex ones. (Take a quick tour of how to use Illustrator with this course.)
Additional Symbols Used in Data Flow Diagrams
- A number of symbols have been changed for data flow diagrams to represent data flow rather than control flow.
- A document is depicted as a rectangle with a wavy base.
- A manual input is depicted as a quadrilateral with the top irregularly sloping up from left to right.
- A data file is depicted as a cylinder.
- A manual operation is depicted as a trapezoid with the longest parallel side at the top.

When to Use Flow Charts
The flowcharts find out steps that are redundant or not in the right place. Also, they identify, appropriate team members, who should provide inputs or resources to whom. Flowcharts can be leveraged to identify areas for improvement and increase efficiency. Brainstorming is useful in creating flowcharts as individuals do not have knowledge of the entire process. The creation of the flowchart results in a common understanding about the process and enhance communication among participants.
Example 1: Flowchart to Find the Sum of First 50 Natural Numbers.
Let’s first see how that will look in a flow chart, and then we see the same thing mapped to a C program. This shows you why it’s important to map out your algorithm to a flow chart, before you start coding it.
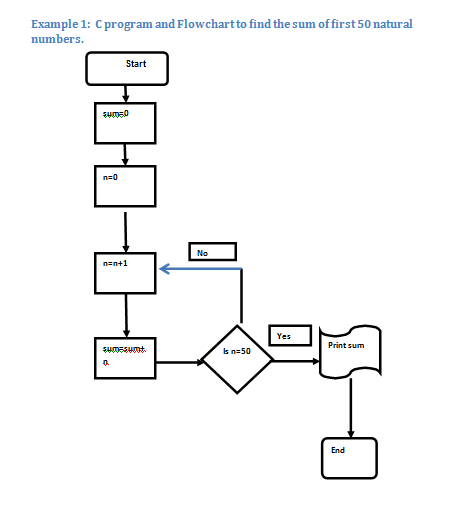
The loop easily translates to a simple C for loop. In this program, we initialize the variable sum =0 and n=0. In the next step, we increment n by 1 and assign sum=sum+n. We check if n=50 and if not, increment n by 1. Else we just print the sum. You may want to check out our beginners C course before moving ahead.
#include <stdio.h>
main()
{
int sum=0, n=0, i;
for(i=1; i<=50; i++, n++)
{
sum=sum+n;
}
printf("sum of the first 50 natural numbers is %d,sum");
}
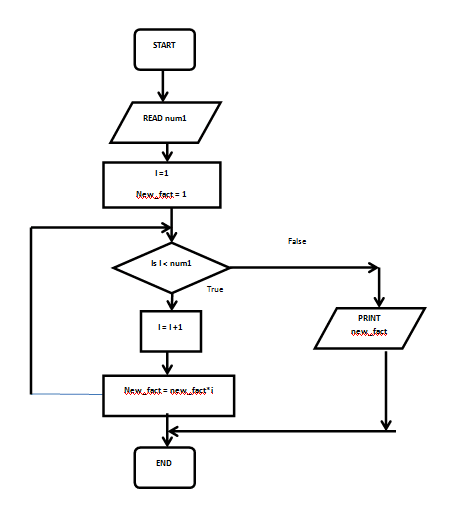
Example 2: C Program to Find the Factorial Value of a Number
Now let’s do a bit more complex example. First we’ll draw out the flow chart for the factorial n
And now let’s see how this translates to the code:
#include<stdio.h>
#include<conio.h>
int main()
{
int num1,i,new_fact=1;
printf("Enter any number : ");
scanf("%d", &num1);
for(i=1; i<=num1; i= i +1)
new_fact = new_fact * i;
printf("Factorial value of %d = %d",n,new_fact);
return 0;
}
Initially we declare the variables num1, i and new_act. We assign the value 1 to new_fact. Then we accept the value of the number into variable num1 whose factorial has to be determined. In the ‘for’ loop we initialize i to value 1. Then we check if value of i = num1. Then we do the operation new_fact*i. After this in the ‘for’ loop i is incremented by 1 and the condition checked. The ‘for’ loop repeats till condition evaluates to fill. In the end we print the desired factorial value. Phew! If you had trouble following that program, you may want to check out this course on C programming to help you out.
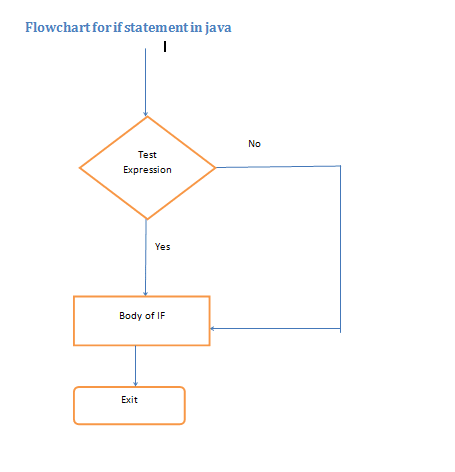
If Statement Introduction in Java
If statements makes decisions and executes different code depending upon whether the condition is true or not. For your information nearly 99% of the flow decisions are made with if. Statemeents. Let’s take a look at an example.
if ((i >= 0) && (i <= 10)){
System.out.println("i is an “ + “integer between 0 and 10");
}
The double and operator “&&” returns true only if both its operands are true. This is displayed in the flowchart representation of If statement. To learn more about Java programming, you can take this beginners course.
JavaScript else if Condition Statement Syntax
Let’s take up another example for flowcharts. What does the if condition look like?
if (conditional expression 1)
{
Statement1 block executed if condition 1 is true(satisfied).
}
else if (conditional expression 2)
{
Statement2 block executed if condition 2 is true(satisfied).
}
else
{
Statement3 block executed if condition 1 and 2 are false( not satisfied).
}
Here is a simple program for the same in Javascript.
<script type="text/javascript">
var my_var=5;
if (my_vart<3)
{
alert(my_var + " is less than 3");
}
else if (my_var==5)
{
alert(my_var + " is equal to 5");
}
else
{
alert(my_var + " is greater than 3");
}
</script>
In this program, initially the script is defined as type javascript. A variable is declared and initialised to a value. Then an if else if statement is executed. if the variable value is less than 3, the program code under if statement is executed. else the control flow branches out to else if statement. Next the else if statement is evaluated. If the evaluation returns true, then the statement under elseif is executed. If the evaluation returns false, then the statement under else is executed. In the end, the script is closed. You can take this course to see how to write your own JavaScript programs.
Analyzing the Detailed Flowchart to Identify Problem Areas
After the flowchart has been created, you need to look out for areas of improvement and areas prone to problems. Here are the steps that you need to follow.
- First, examine each decision symbol to see if it is effective and not redundant.
- Check whether the rework is preventing the problem or issue from reoccurring.
- You need to examine each activity symbol to see whether its error prone and provides significant value addition.
- Note that each document or database symbol needs to be examined to see whether it is necessary up to date and useful.
- Each wait symbol needs to be examined to see its length and whether its length could be reduced.
- Another important thing is to study each transition. It is important to know whether the intermediate service or product meets the requirements of the next person in the process.
- Finally, the overall process needs to be study. Find out whether the flow is logical, there are control flows which lead nowhere and are there parallel tracks.
Hope this article on flowcharts gets you up and running in creating your own customized flowcharts. Flowcharts are important to visualize and give a path to create useful and powerful programs.