Article Summary
Building a KPI dashboard in Excel turns raw sales data into clear, filterable visuals. This article walks through creating pivot charts, pie and bar graphs, and linking slicers and timelines to a clean dashboard sheet. You'll gain the skills to track performance metrics and spot gaps at a glance.
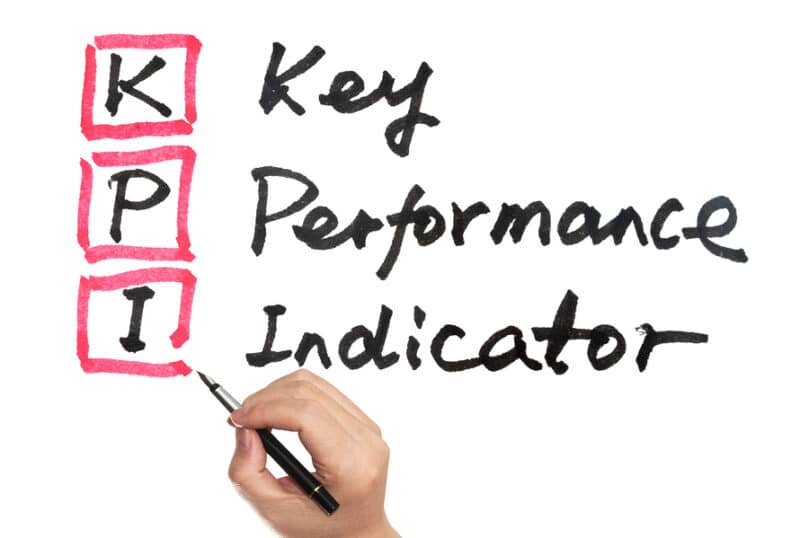
Key performance indicators or KPIs are a highly effective way of measuring business success. The important thing to realize about KPI and KPI measurement, is that your KPI system is only as good your choice of metrics or rather what you chose to monitor as indicators of success. KPIs can be used to measure all sorts of processes within the business, from finance to sales to production and projects. Creating a KPI dashboard to keep track of performance can be one of the most effective tools a manager or CEO has. If you are interested in learning about metrics and how to create measures for success, try Using Your Data to Grow Your Business course. Join thousands of students who are learning to track details about their customers, products, sales and purchases to ensure their organizational growth and success. Key performance indicators will help you learn about your customers and what they want. This course will teach you how to discover the most important metrics for any business. It will teach you how to really harness the power of metrics within your organization. It will show you how to track customer loyalty and prevent customer defection.
There are a number of different software applications that will help you build and then keep track of your key performance indicators. KPI dashboard software packages include Domo, SimpleKPI, Geckoboard and Cyfe. Essentially, these applications all perform the same function: the creation and monitoring of your key performance indicators. You can also create your own KPI dashboard using Excel. This tutorial will show you how to set up a simple KPI dashboard in Excel. You can use these steps to create your own dashboard with your own metrics.
Here is the initial table of data we will use for our KPI dashboard:

The data is based on two different areas called North and South. There are three salespeople and three different products that we sell and we also have a row for target sales. You can use whatever data represents your key performance indicators. To set up the KPI dashboard, we will start by creating some pivot tables and graphics to represent the data we wish to see on the dashboard.
Creating a Bar Chart for Our Dashboard
To create the pivot table and graphics, select the data, then select INSERT and PIVOT Chart. Then select your data area and click okay. Our first KPI chart we create will show unit sales and it will allow the user to filter the data by month or salesperson.
So to create this graph, we selected our data, clicked pivot and chart, then selected the data we want to include:

Then we select product, month, salesperson and unit sales fields to our new pivot table. We want the graph to show unit sales so that goes in the values section. The month and salesperson are fields we want to use as our filters for this graph so those go in the filters section. The graph is designed to show the sales per product so ProductID goes in the Axis Section. Make sure that the fields you want to use as selection fields, appear under the filter section of the graph. The filter section will allow you to set up selection criteria later on for all of the graphs.

Select the type of graph you want to show on your dashboard area. To select the style and type of graph, click on the graph that Excel has created for you and then select the Pivot chart tools, design tab.

Once you are happy with your first graph, go ahead and make another graph for your dashboard. We will create our second graph to reflect unit sales as a pie graph.
If you would like to improve your graphing skills within Excel, check out the Microsoft Excel 2013 Course Beginners/ Intermediate Training course from Udemy.
Creating a Pie Chart for the KPI Dashboard
We will add a pivot chart and table again and then select the same source data. This pie chart will show the sales by salesperson by month so a manager can see the breakdown of products sold per month for all of the sales people or for each sales person.
The fields for our pivot table will therefore be as follows:

The Salesperson, area and month field must be placed in the filters column so that we can use them as selections later. This is what our pie chart looks like:

Create the rest of the graphs you want to use in your dashboard and then create a new sheet for your dashboard.
Learn to use Excel like a pro now by signing up for theMicrosoft Excel 2013 Advanced. Online Excel Training Course. This course contains over one hundred lessons and lectures designed to take your Excel skills to the next level. It will teach you to use Excel in a commercial environment and help you to understand the more powerful, advanced features and functions in Excel.
Creating the Dashboard
Create a new sheet and call it dashboard. Remove the gridlines to get a clean sheet. To remove the gridlines select the view menu and then uncheck the gridlines option:

Now move each of your graphs to the dashboard sheet you made, use the cut and paste option to paste the graphs onto your dashboard page:

We will now add timeline sliders and slicers that will control the data within each of our graphs:

To add a timeline to control the selection of the various timeline aspects of the graphs, click on one of your graphs and then select Analyze from the Pivot tools tab and then select Insert Timeline:

Select the month field.

Excel will automatically add a timeline selector for that graph to allow the user to select the months he wishes to view:

Now we need to add that filter connection to our other graphs, so select the other graphs and select Analyze and then select the Filter Connections button to make a connection between that selector and your other graphs:

Select the month field under the filter connection to link that graph to the filter. Now we will follow the same procedure to add slicers so that a user can select a specific area or salesperson. Click Analyze and select Insert Slicer to one of the graphs. Select the area, Product and Salesperson fields and Excel will automatically add these slicers to your worksheet:

Once again you need to go and create the filter connections for each of the fields for each of the graphs. Now all of your graphs will be filtered by the same selection criteria. Your final dashboard page will look like this:

If you select the North Area and George and select sales for January using the timeline slider, all the graphs change to this:

So a manager can immediately see that George did not meet his sales targets for the iPad and PC categories for January.
If we select Jack’s Sales, all the graphs change and you can see that Jack sold enough iPads and Laptops but not enough PC’s:

Wow Your Boss with a Custom KPI Dashboard
As you can see from the above, creating a custom KPI dashboard in Excel is not too hard. Create your own KPI dashboards and make sure you have your finger firmly on the pulse of your own business today, or create one to wow your boss.
For more advanced features and functions in Excel, sign up for the Learn Microsoft Excel 2013 – Advanced training course now. This course contains over fifty two lectures that will teach you to work with dates and times, and how to include pivot charts, sparklines and data bars to your worksheets.