Article Summary
The linear correlation coefficient (also called the Pearson Product Correlation) measures the direction and strength of the relationship between two variables, expressed as a value from -1.0 to +1.0. This article explains how to interpret r values and calculate them in Excel. Readers will gain a clear, practical understanding of this essential statistical tool.
The linear correlation coefficient, otherwise known as the Pearson Product Correlation is arguably the most widely used correlation measurement tool. It’s sometimes referred to as just the correlation coefficient. It’s most notable use is applied to recognize trends in business and economic sectors but it can be used for pretty much any measurable data you need analyzed. In the Introduction to Statistics course you can learn more about relationship measurement, variable and charts and graphs that display visual interpretations of this data.
Linear Correlation Coefficient
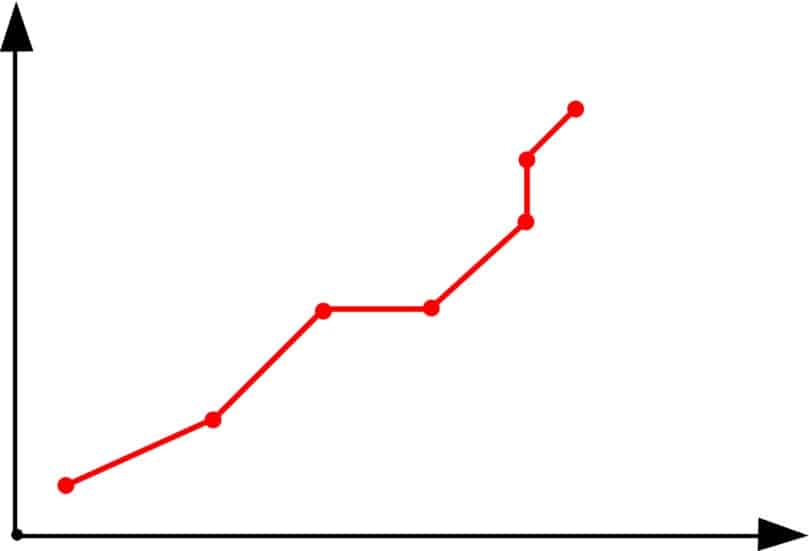
In statistics this tool is used to assess what relationship, if any, exists between two variables. It measures the direction and strength of the relationship and this “trend” is represented by a correlation coefficient, most often represented symbolically by the letter r. When used to represent populations a capital R or the Greek letter Rho, written as ρ. A correlation exists when two variable are involved in a relationship (so to speak) and a change in Variable A affects the status of Variable B, or vice versa. The variables in a correlation can move in the same direction or opposite directions which indicates if it is a positive or negative correlation. There are other types of variable measurement tools such as Kendall’s Rank or Spearman’s Rank but these measure different types of relationships and cannot be used as an alternative to the linear measurement tool. Lear more about using a correlation for statistical analysis in this quick-to-read article.
Correlation Coefficients
Above I mentioned correlation coefficients as r, R or ρ. So what exactly is this and how do you get it? A correlation coefficient is a number between -1.0 and +1.0 which represents the magnitude and strength of a relationship between variables. It’s a way for statisticians to assign a value to a pattern or trend they are investigating For example, an r value could be something like .57 or -.98. Depending on the number and whether it is positive or negative, the correlation will be determined as negative or positive, weak or strong, or non-existent. Use the chart below to learn how the value of r corresponds the strength of a relationship.
| Value of r | Strength |
| -1.0 to -0.5; 1.0 to 0.5 | Strong relationship |
| -0.5 to -0.1; 0.1 to 0.5 | Weak relationship |
| -0.1 to 0.1 | None or very weak |
So a correlation coefficient of -.59 would be considered a strong negative relationship whereas an r value of .15 would be considered a weak positive. There is a complex equation that can be used to arrive at the correlation coefficient, but the most effective way to calculate it is to use data analysis software like Excel. Excel has a slight learning curve so if you’re not familiar with the program take a few minutes to check out this Excel 2013 course. Let’s run through an example of calculating and graphing a correlation coefficient.
- Step 1
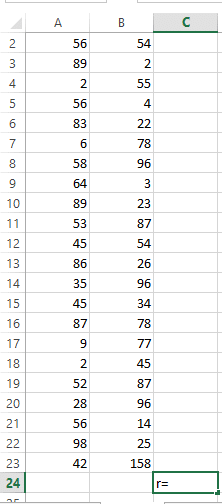
Add your data to a new spreadsheet in the first two columns, Column A and Column B. You should put your independent variable in column A and your dependent variable in column B. If you want to label these columns you can do so by replacing independent and dependent variable with appropriate titles. Should you decide to title these columns you want to start entering your data in cell A2, B2, C2 and so on, as your titles will be in cells A1, B1, C1 etc.
- Step 2
Now select a cell where your r value (once calculated) should be entered.
- Step 3
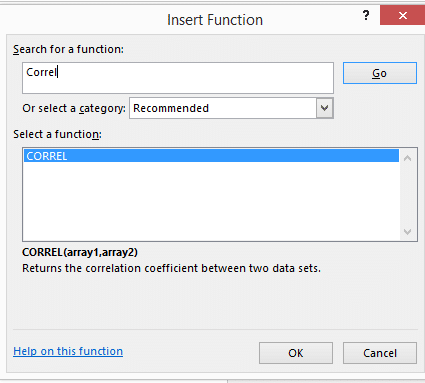
There are two ways to retrieve the correlation coefficient in Excel – both ways using formulas, but one is a little (okay, a lot) easier than the other. However, to get a good understanding of what is happening behind the scenes with your data let’s begin with the harder method. Then we’ll mosey onto the easy one. For the first method, we are going to search for a function within Excel to use. Before you begin the search, click on the cell you designated as your r value. For me, this was C24. Now go to the top of your screen and select the Formulas ribbon (in-between page layout and data). With formulas highlighted, select the Insert Function button to the far left. Formulas and functions are an integral component to Excel. There are a zillion you can choose from that perform different calculations and they are incredibly handy for analyzing data. Learn all you can eat about Excel Formulas and Functions in this in-depth course.

- Step 4
A dialog box will open and in the search for a function field type CORREL.
- Step 5
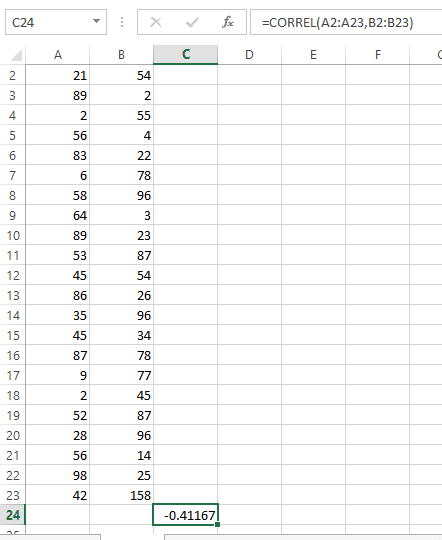
You should now see a box titled Function Arguments that has two fields: Array1 and Array2. In each of these fields you are going to type the scope of cells for each column respectively. Array1 is column A, Array2 is column Band so on. For this example data I’ll input A2:A23 in Array1 and B2:B23 in Array2. Click OK. The correlation coefficient for your data will now be entered into the cell you selected for your r value.
Simple Method
We’re going to skip the Insert Function avenue, and just go straight to typing in the formula that this function generates into the r value cell. Use the formula:
=CORREL(A2:A23,B2:B23)
The correlation coefficient for the set of data used in this example is r= -.4. This is a negative coefficient that is closer to farther away from 1 than 0 which indicates the linear relationship between these independent and dependent variables is a weak negative correlation. To learn how to graph this correlation into an easy to ready (and easy to customize) Excel graph, check out the online course Mastering Excel Graphs. If you haven’t spent much time exploring Excel now is a good time to do so. It’s an incredibly comprehensive tool that can do more things than most people know it’s capable of – the correlation coefficient is just the beginning.